Providing daily reports for Pressed Juicery in nearly all 50 states
Generating footfall analytics and monitoring queue employee engagement
LEARN MOREProviding empoyee behavior and Kiosk ordering analytics
Reliable data with challenging camera coverage in complex airport terminal settings.
LEARN MOREThe fastest way to expand your actionable analytics
Learn more about our strategy and how we can help you as the Business Intelligence leader
Measure Dining Room Use
Floor plan Optimization
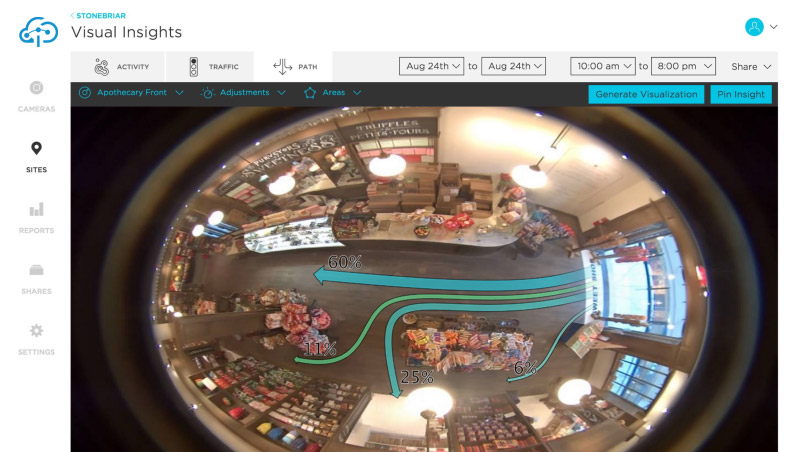
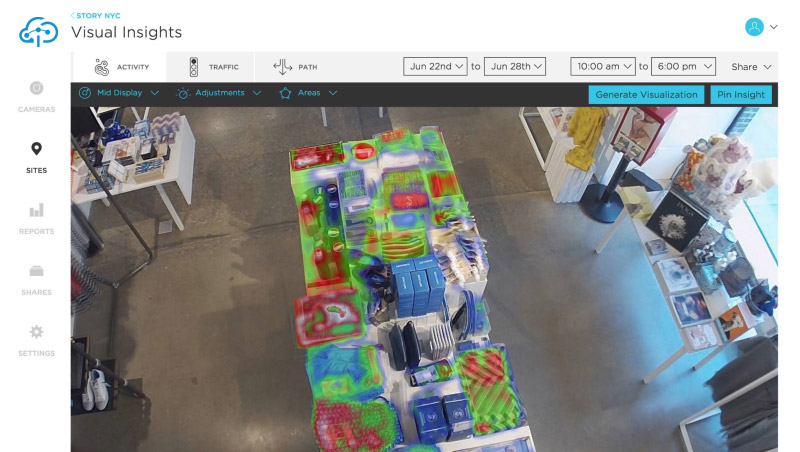
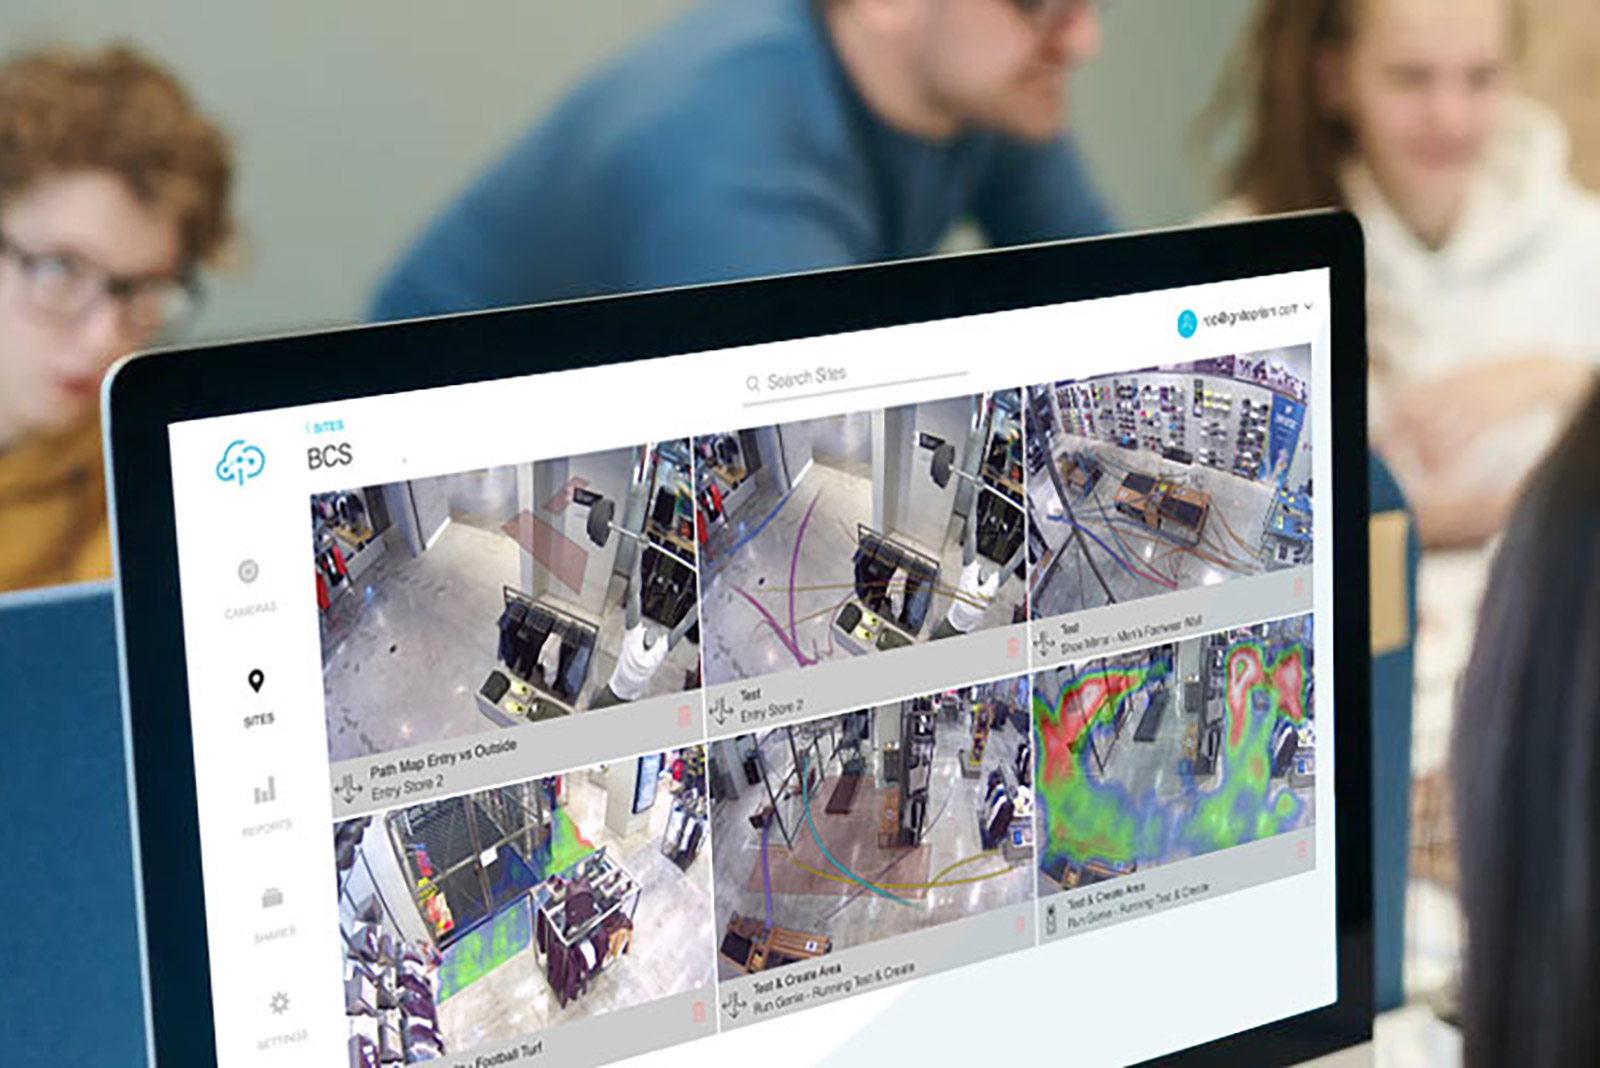
Propose dining room layout designs and measure the effectiveness with engagement analytics, traffic heat maps, and customer walk paths. Every produced Visual Insight shows the dining room furniture and customer path, but never a recognizable person.
Measure everything and observe restaurant use
One Sensor: Multiple Features
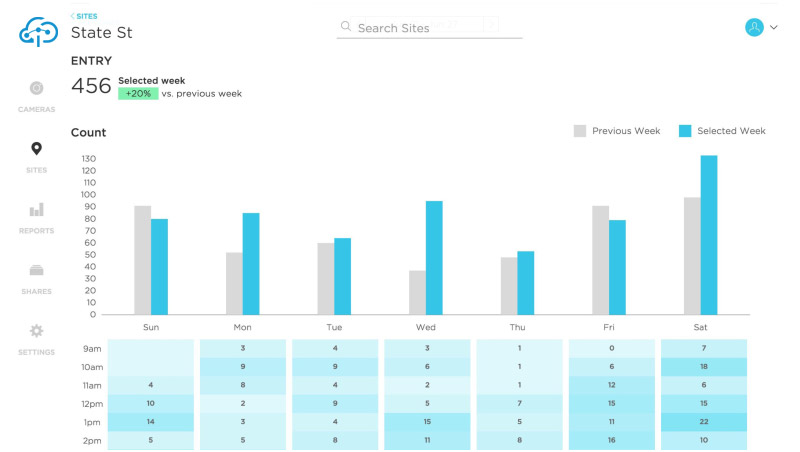
Use the same sensor that reports on footfall in real-time to also measure pass by traffic (conversion), and directional path after entrance, observe restaurant traffic maps, table use, and much more.
Predict Guest Visits
Staffing Planning
Utilize the periodic reports to understand and anticipate peak and seasonal order queue lines. Compare real-time hourly traffic against the measured traffic and wait-times from a week ago.
Growing camera analytics technology for 10 years.
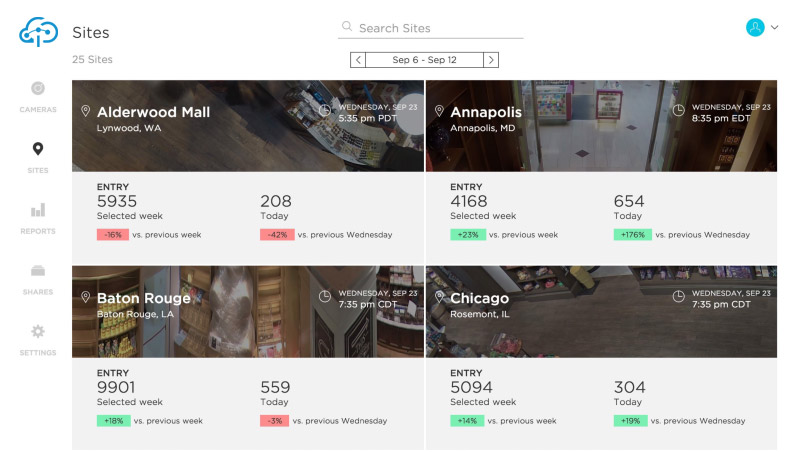
Powerful Dashboards
Robust Analytics

Enterprise Reporting
Behavior Visualization
Product Interaction
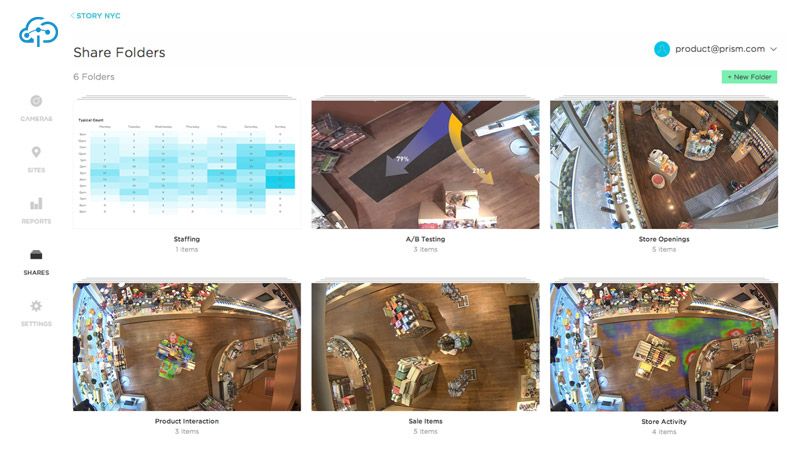
Securely Share Folders

Privacy Filter
Complete Suite
Analytics and Reporting
Our universally applicable tools have the flexibility of specific optimization for virtually any industry, ensuring that the correct vernacular is used in reporting and that data labels that reference special industry-specific items or events are clearly communicated to every stakeholder who relies on the service.
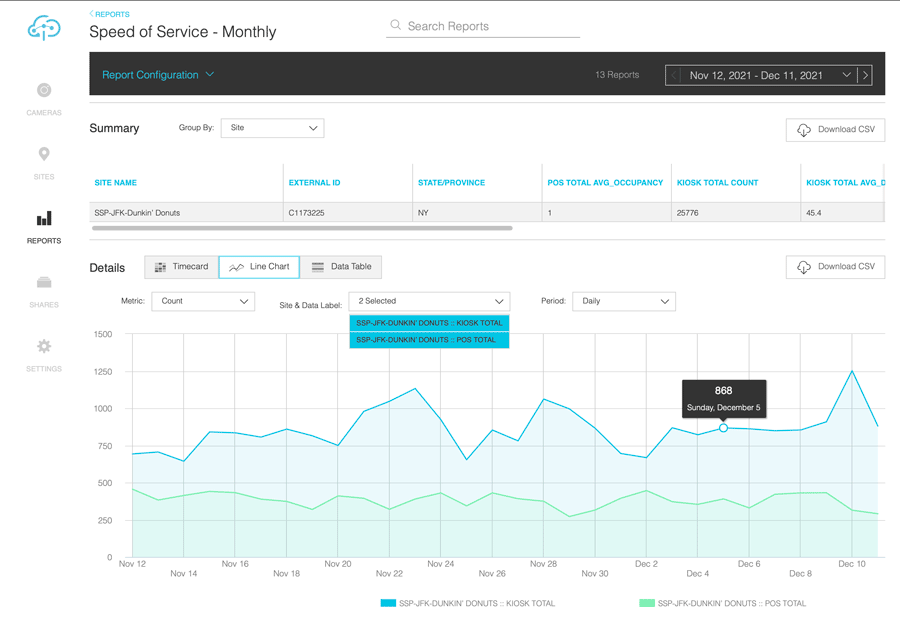
Kiosk vs POS line
Measure to Improve Guest Service and Expectations
Reports provide hourly analytics insights in Kiosk 1 and Kiosk 2 performance on both counts as wait times (dwell) compared against the typical order line (POS).
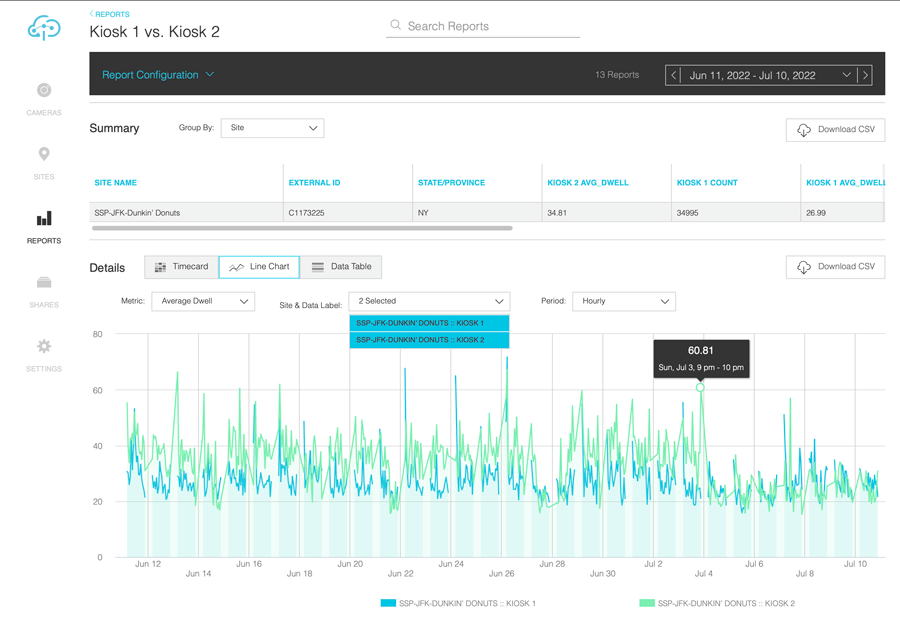
Kiosk Ordering Performance
Hourly Average Dwell comparison between Kiosk 1 and 2
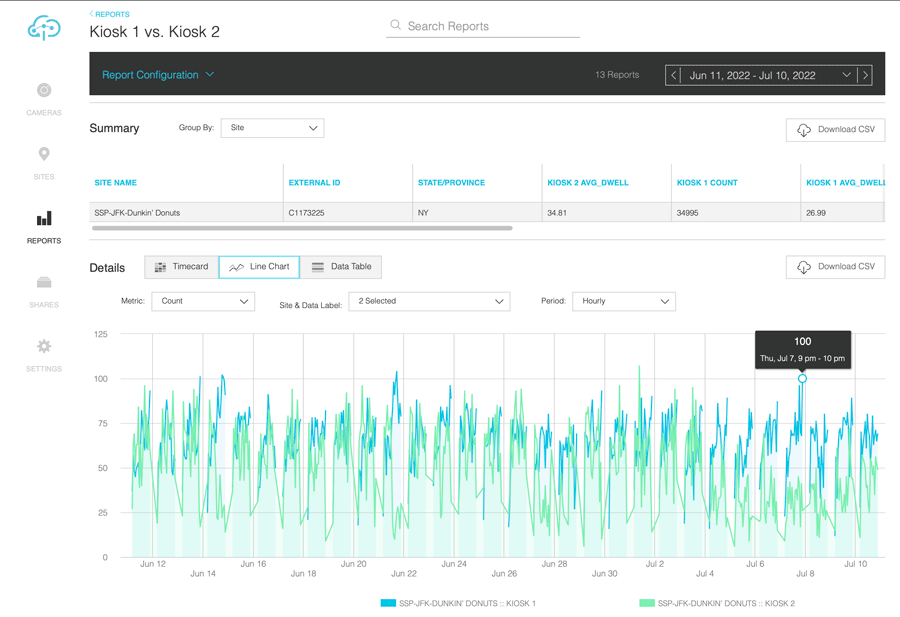
Kiosk Ordering Performance
Hourly Count comparison between Kiosk 1 and 2
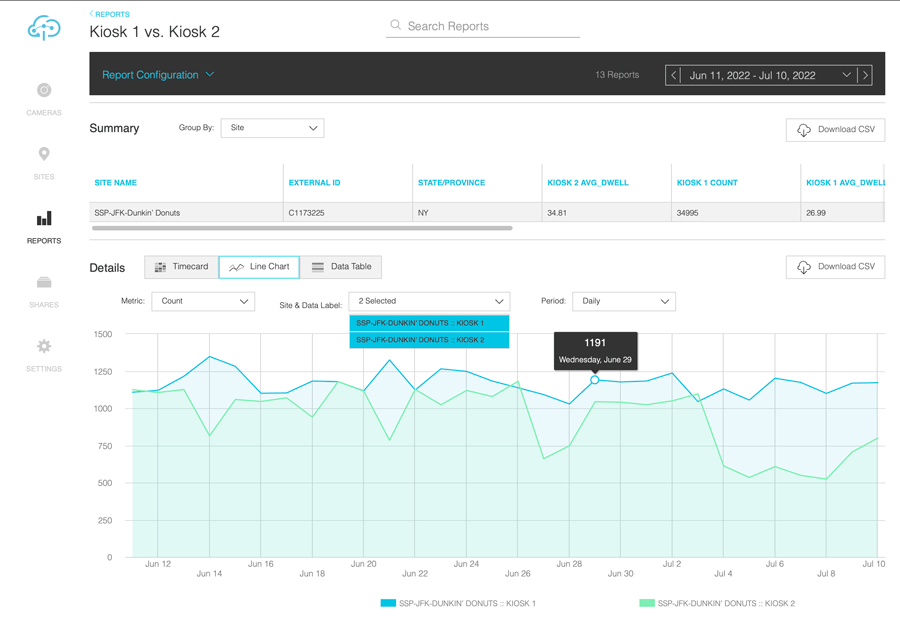
Kiosk Ordering Performance
Daily Count comparison between Kiosk 1 and 2
Kiosk Ordering Performance
Daily Count comparison two Kiosks and POS
EXPAND YOUR BUSINESS INTELLIGENCE
Advise your customer with actionable ideas based on store specific knowledge and multi-store-wide trends


CORE PRODUCT
Practical Applications
DINING ROOM SPACE USE
IDENTIFY BEST TABLE PLACEMENT LAYOUT, HI-TOPS vs BOOTHS.
OPERATIONS
OPTIMIZE GUEST-QUEUE-LINE AND ORDER FLOW.
CLEANLINESS
15 MINUTE TIME-SPAN-FLIPBOOK IDENTIFIES TRASH, DIRTY TABLES, AND OTHER EYESORES.
MARKETING
MEASURE REAL-TIME FOOTFALL COUNT IN CONJUNCTION WITH AN ONLINE MARKETING CAMPAIGN OR COUPON OFFERING.
CONTACT IGNITE PRISM
Please let us know if we can setup a web demo.
Upon your request, we can walk you through all of the Ignite Prism features, audit tools, and API possibilities.
,
Let's Talk Business.
Please do not hesitate to contact us to engage in a conversation.