Analytics for each of the 10 POS areas for each store
Generating analytics and visual insights for queue lines
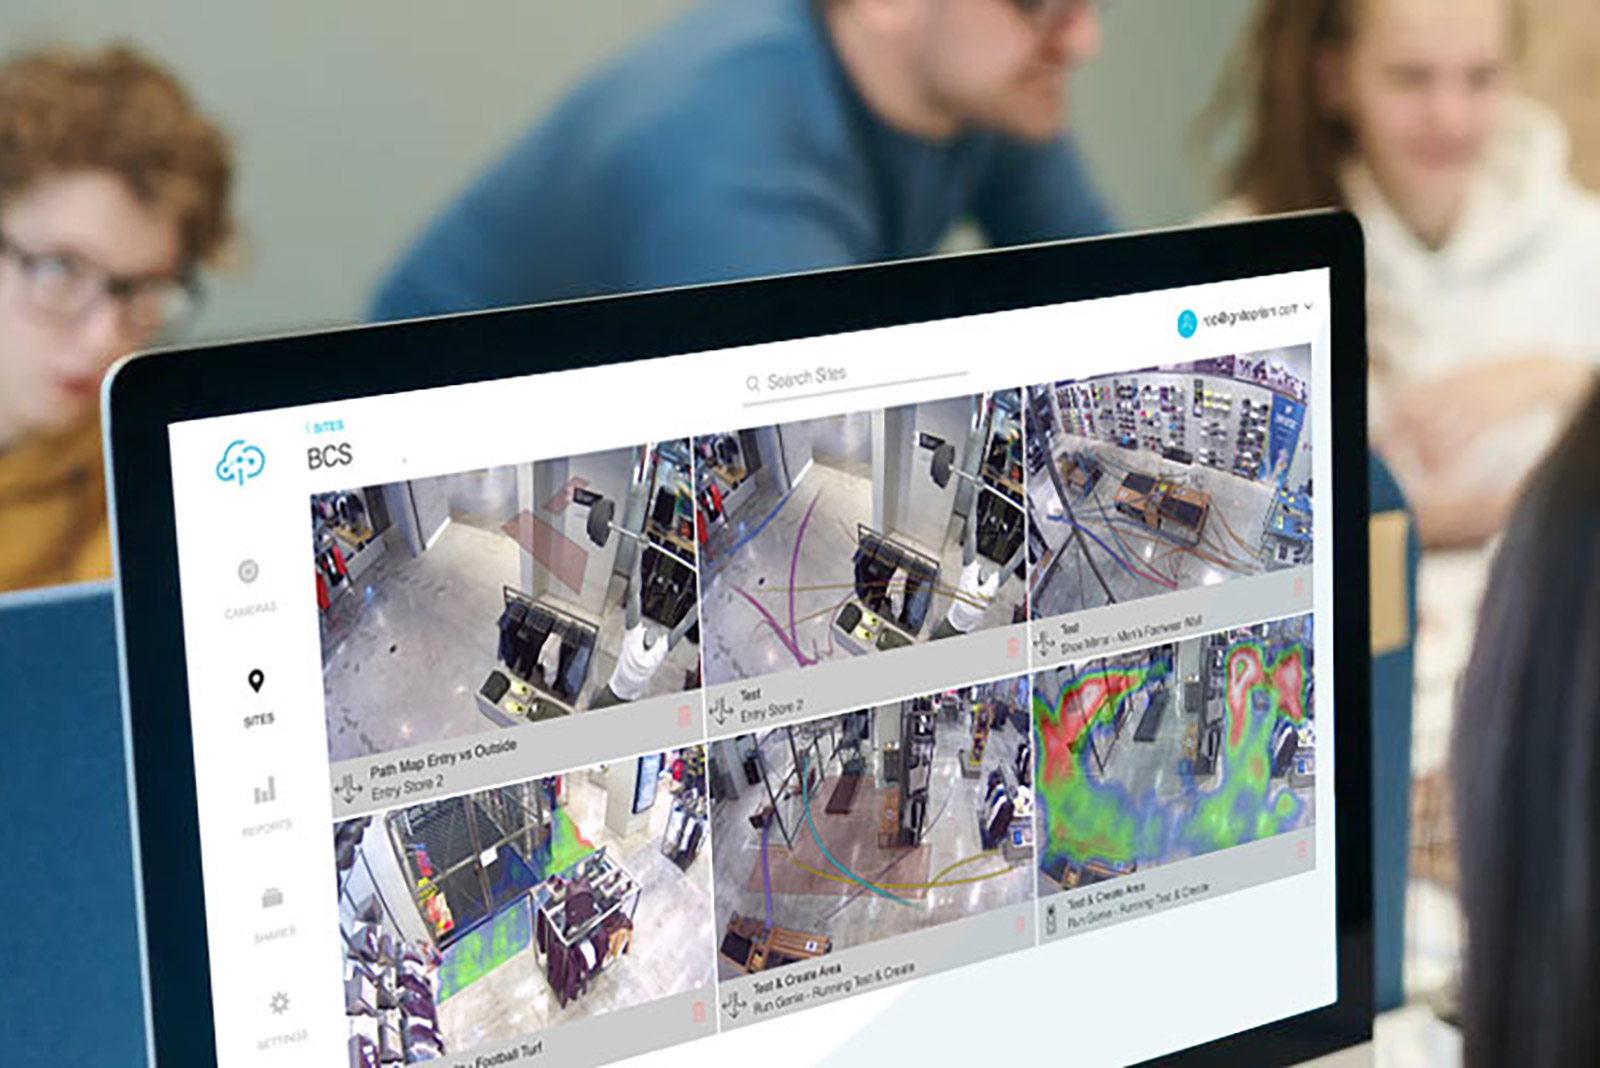
LEARN MOREProduct interaction heatmaps for King Living
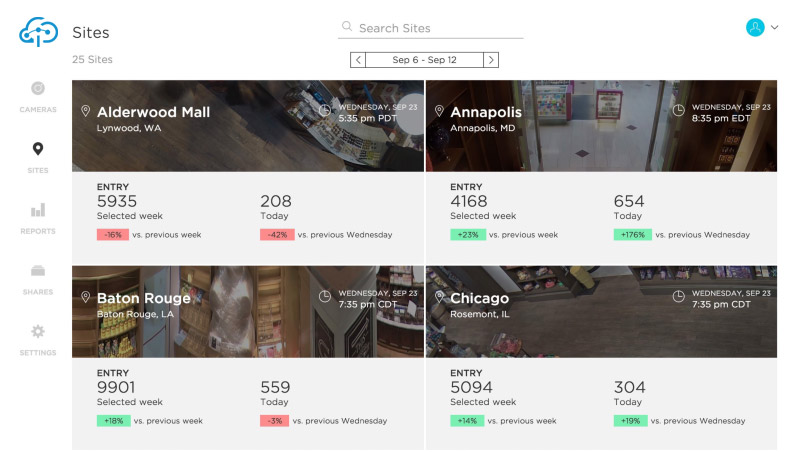
Comparing data across the global flagship stores
LEARN MOREThe fastest way to expand your actionable analytics
Learn more about our strategy and how we can help you as the Business Intelligence leader
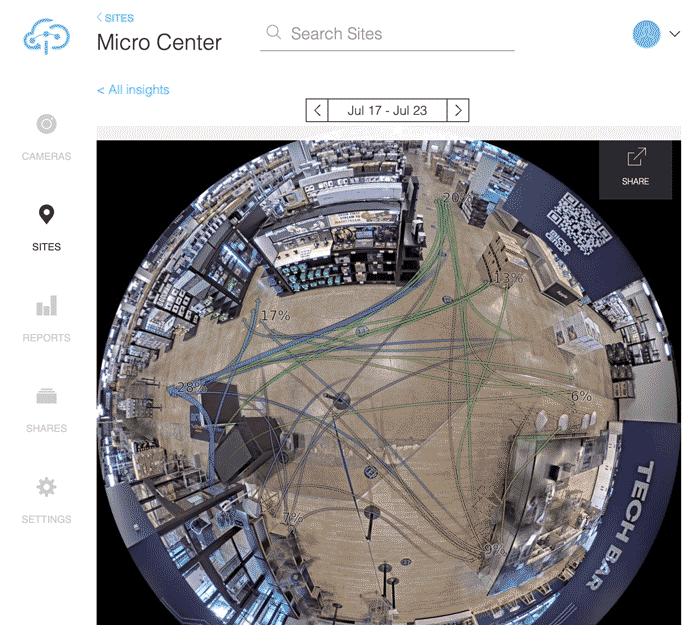
Measure Store Layout Effectiveness
Flexible Floor Plans
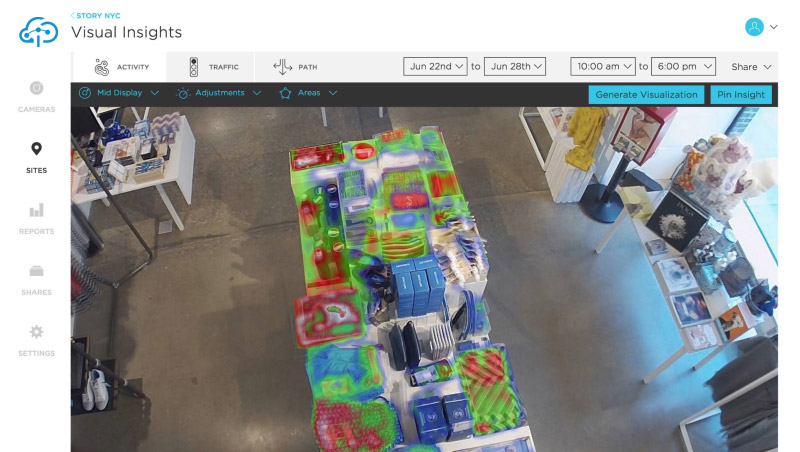
Propose new store layout designs and measure the effectiveness with engagement analytics, traffic heat maps, and customer walk paths. Every produced Visual Insight shows the products and customer path, but never a recognizable person.
1 Site, 50,000 SQFT, 13 Sensors, 44 Analytics
One Sensor: Multiple Features
Use the same sensor to report on
- Footfall
- Occupancy
- Dwell
- Path maps
- Traffic maps
- Activity maps
Cap-End and store-in-store analysis made easy
Monetize based on Measured Performance
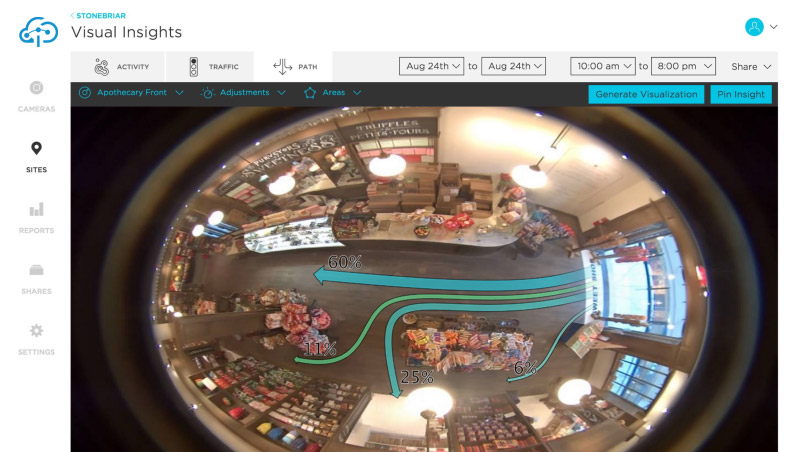
Utilize the extremely flexible Areas Of Interest (user defined without engineering requirements) to define areas for customer count, occupancy, and dwell analytics with periodic reports to understand product specific engagement and interaction popularity trends. Compare real-time hourly traffic against the measured traffic from a week ago, or against other store areas and/or products. User-defined data labels take the guessing out of the references that are made in the reports. It is possible to use SKUs or descriptives like: Desktop Apple iMac.
Growing camera analytics technology for 10 years.
Powerful Dashboards
Robust Analytics

Enterprise Reporting
Behavior Visualization
Product Interaction
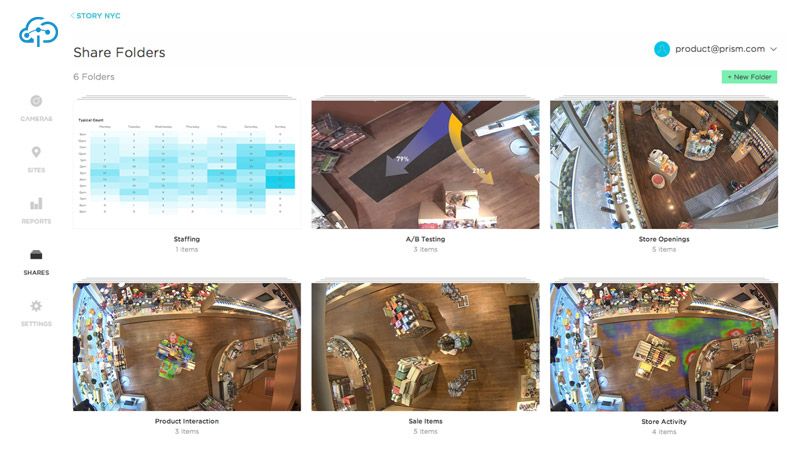
Securely Share Folders

Privacy Filter
Complete Suite
Analytics and Reporting
Our universally applicable tools have the flexibility of specific optimization for virtually any industry, ensuring that the correct vernacular is used in reporting and that data labels that reference special industry-specific items or events are clearly communicated to every stakeholder who relies on the service.
POS Visual Insights
Measure to Improve Customer Experience
Reports provide hourly Visual Insights to expose the activity around each POS. Such insights can then be compared against the average POS activity and offset against line queue activity and wait times.
Unlimited Visual Insights can be created, without engineering needs, over time periods as short as one hour and as long as a full week. Conveniently share such insights with other users and compare automatically created weekly Visual Insight snapshots to identify customer behavior or employee trends.
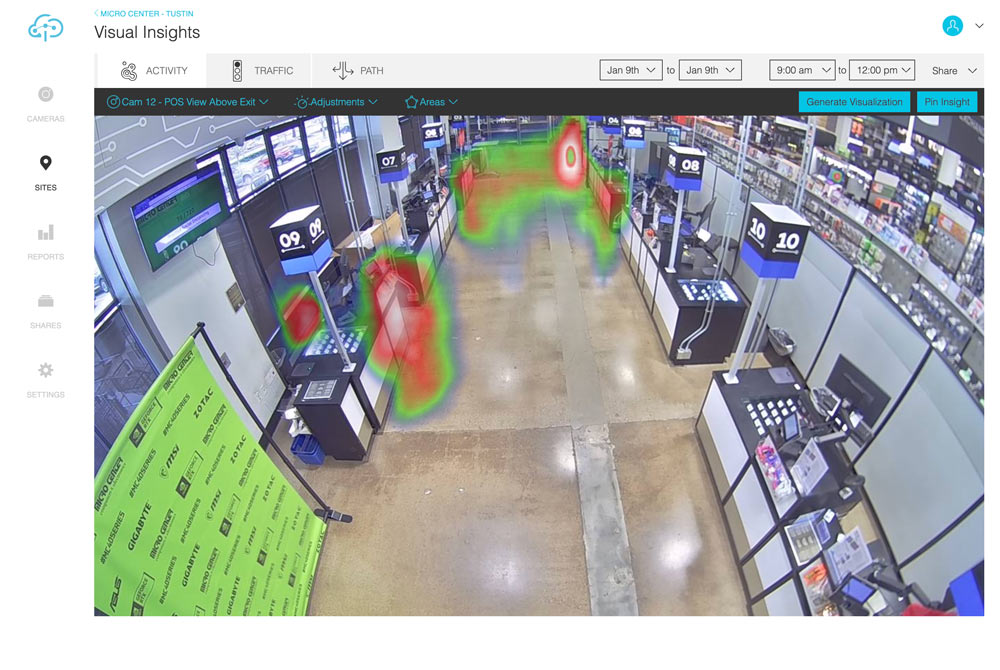
10 Station POS Area
3h Average Customer Activity
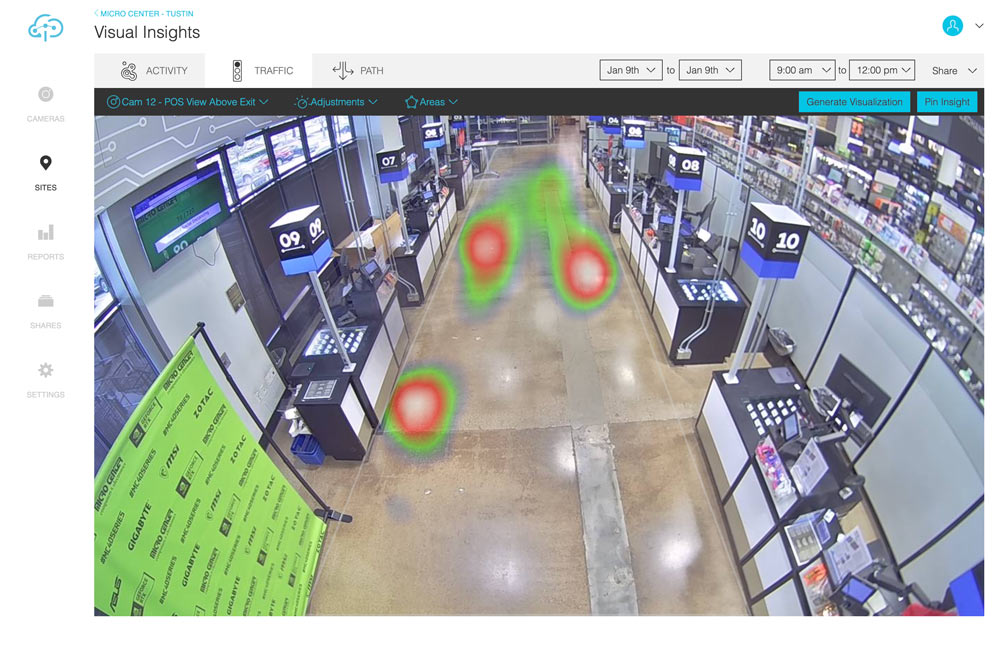
10 Station POS Area
3h Average Customer Dwell
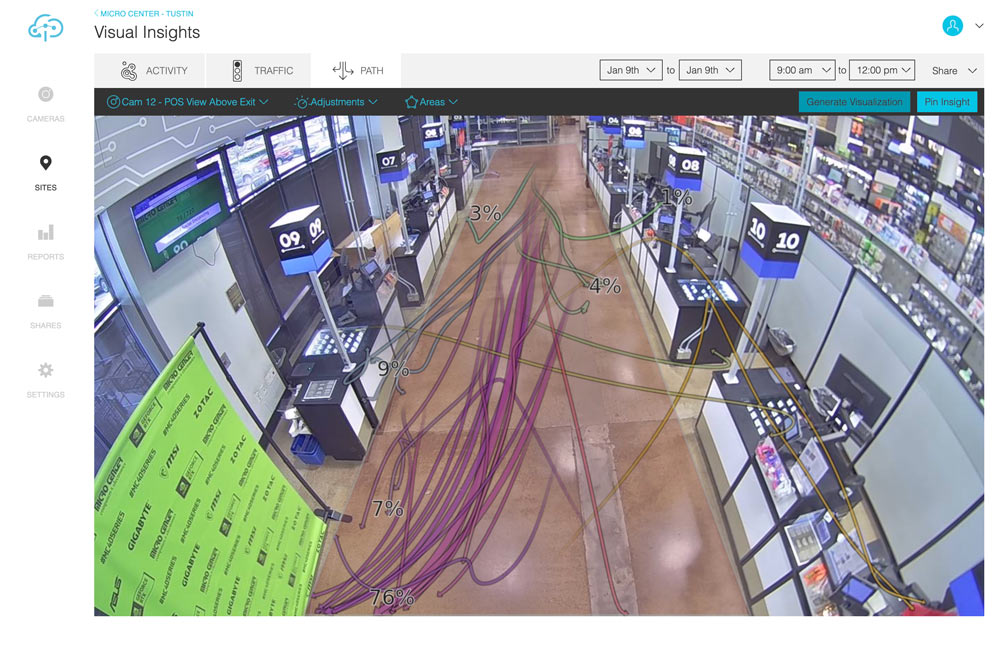
10 Station POS Area
3h Average Customer Path Movement
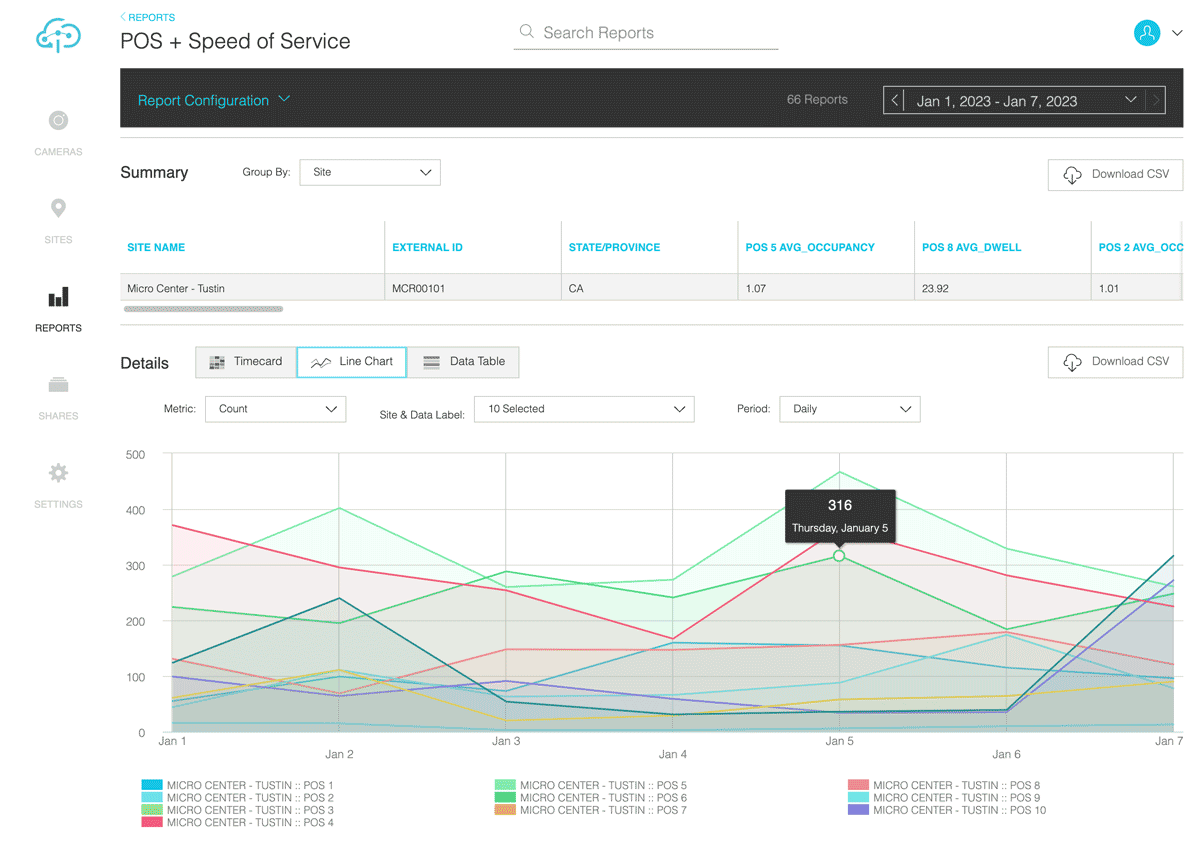
POS Analytics Reports
Daily Counts
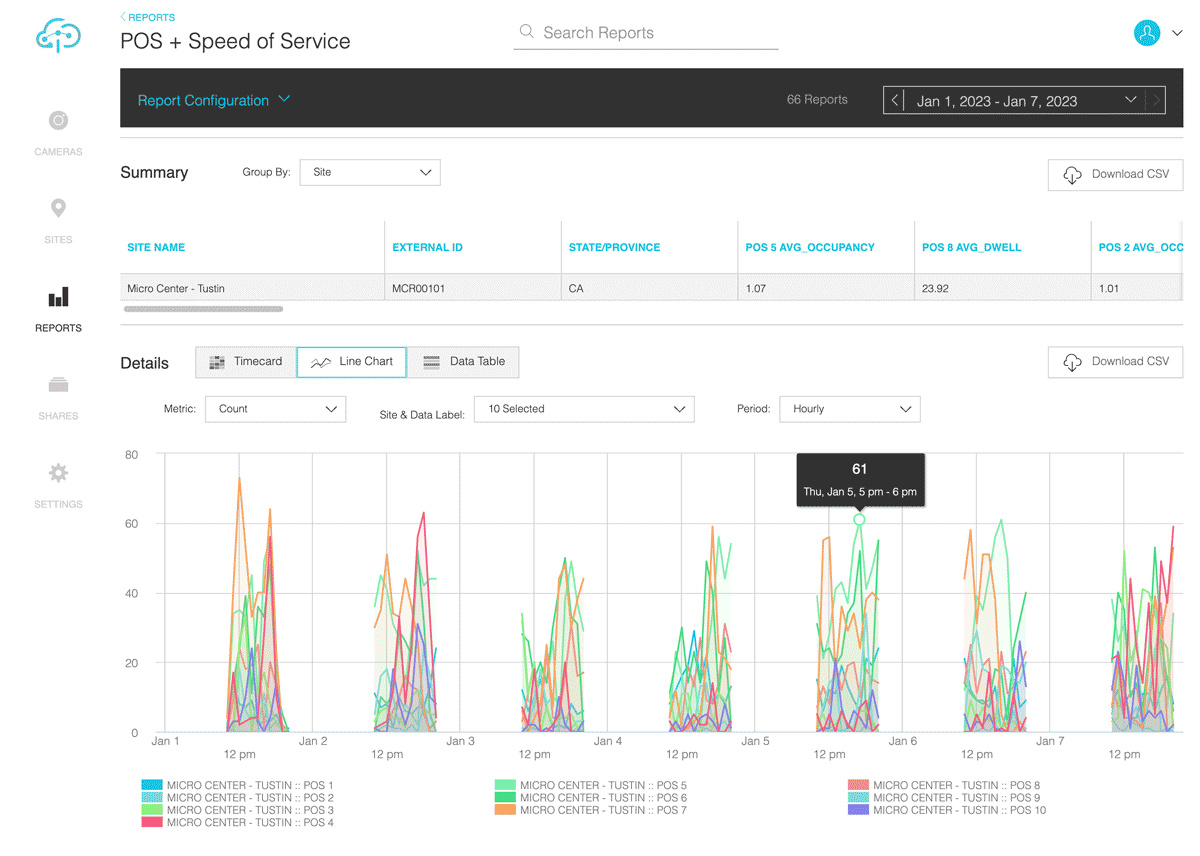
POS Analytics Reports
Hourly Counts
POS Analytics Reports
Daily Employee Engagement
POS Analytics Reports
Hourly Employee Engagement
Speed of Service
Let Context and Analytics Expose Performance
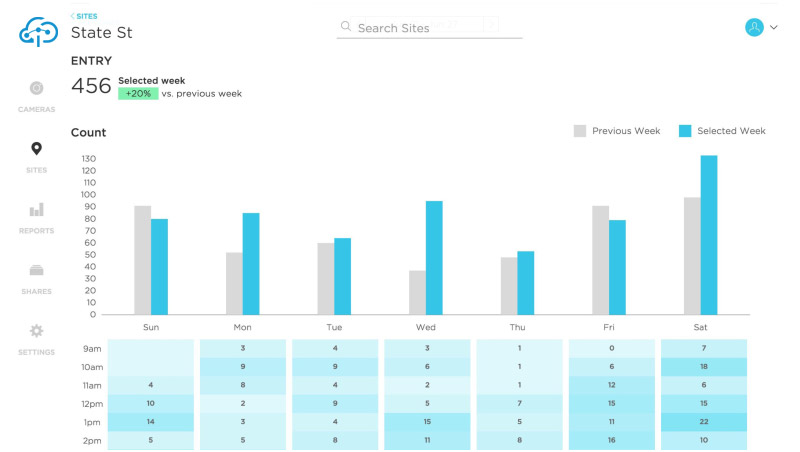
Reports on Customer Count and Average Dwell can be defined at hourly, daily, monthly, quarterly, and yearly intervals. Stakeholders who are subscribed to these automated periodic reports will be notified by email whenever a report has completed the pre-set time cycle. This ensures that any involved stakeholder can use the latest data for further analysis and reporting to the client.
Take advantage of the API integration to query and retrieve near real-time data in almost any desirable format to be included or combined with other data sources.
EXPAND YOUR BUSINESS INTELLIGENCE
Advise your customer with actionable ideas based on store specific knowledge and multi-store-wide trends


CORE PRODUCT
Practical Applications
STORE DESIGN
IDENTIFY STORE LAYOUT GLITCHES TO INCREASE SHOPPING EFFICIENCY.
MERCHANDISING
SELL MORE BY ADAPTING A BETTER PRODUCT PLACEMENT STRATEGY.
OPERATIONS
ANALYZE TRENDS AND ALIGN YOUR RESOURCES WITH THE IN-STORE SHOPPER BEHAVIOR.
MARKETING
USE DWELL & OCCUPANCY TO MEASURE CAMPAIGN EFFECTIVENESS.
CONTACT IGNITE PRISM
Please let us know if we can setup a web demo.
Upon your request, we can walk you through all of the Ignite Prism features, audit tools, and API possibilities.
,
Let's Talk Business.
Please do not hesitate to contact us to engage in a conversation.